Market Outlook
April 26, 2017
Market Cues
Domestic Indices
Chg (%)
(Pts)
(Close)
Indian markets are likely to open positive tracking the SGX Nifty and Asian markets.
BSE Sensex
1.0
287
29,943
The U.S. stock markets rose sharply on Tuesday as solid quarterly reports from
Nifty
1.0
89
9,307
several large-cap companies rolled through.
Mid Cap
1.1
155
14,781
The majority of the European markets ended Tuesday's session with modest gains,
Small Cap
0.6
189
15,380
following yesterday's strong rally. The markets surged Monday after Emmanuel
Bankex
1.0
255
25,003
Macron's victory in the first round of the French presidential election on Sunday.
Indian Markets followed global markets higher on Tuesday, with the Nifty index
Global Indices
Chg (%)
(Pts)
(Close)
closing above 9,300-mark for the first time ever, as Reliance Industries' Q4 profit
Dow Jones
1.1
232
20,996
beat estimates and the rupee rose against the dollar on improved risk appetite
following Emmanuel Macron's victory in the first round of the French presidential
Nasdaq
0.7
42
6,025
election.
FTSE
0.2
11
7,276
Nikkei
(01.1
203
19,079
News Analysis
Hang Seng
1.3
316
24,456
Review: Wipro, LIC
Shanghai Com
0.2
5
3,135
Detailed analysis on Pg2
Investor’s Ready Reckoner
Advances / Declines
BSE
NSE
Key Domestic & Global Indicators
Advances
1,483
1,897
Stock Watch: Latest investment recommendations on 150+ stocks
Declines
1,457
787
Refer Pg6 onwards
Unchanged
159
89
Top Picks
CMP
Target
Upside
Volumes (` Cr)
Company
Sector
Rating
(`)
(`)
(%)
BSE
4,007
Blue Star
Capital Goods
Accumulate
677
760
12.2
NSE
29,309
Dewan Housing Fin. Financials
Accumulate
431
460
6.8
Mahindra Lifespace
Real Estate
Buy
428
522
21.9
Navkar Corporation Others
Buy
215
265
23.3
#Net Inflows (` Cr)
Net
Mtd
Ytd
KEI Industries
Capital Goods
Accumulate
212
239
12.4
FII
(227)
(1,334)
42,887
More Top Picks on Pg4
MFs
450
6,332
15,770
Key Upcoming Events
Previous
Consensus
Date
Region
Event Description
Top Gainers
Price (`)
Chg (%)
Reading
Expectations
Apr 27, 2017 Euro Zone Euro-Zone Consumer Confidence
-3.60
-3.60
Bioconm
1,166
9.4
Apr 27, 2017 US
Initial Jobless claims
244.00
245.00
Indianb
311
9.0
Apr 27, 2017 Euro Zone ECB announces interest rates
0.00
0.00
Iifl
490
6.6
Apr 28, 2017 China
PMI Manufacturing
51.80
51.70
Bayercrop
4,595
6.5
Apr 28, 2017 US
GDP Qoq (Annualised)
2.10
1.00
Deltacorp
177
5.9
Apr 30, 2017 UK
GDP (YoY)
1.90
2.20
More Events on Pg5
Top Losers
Price (`)
Chg (%)
Rallis
240
(4.4)
Sanofi
4,250
(3.2)
Hathway
46
(2.6)
Rtnpower
9
(2.5)
Gmrinfra
18
(2.5)
#As on April 25, 2017
Market Outlook
April 26, 2017
Result Preview:
Wipro (CMP: `496 / TP: `583 / Upside: 17.5%)
The company posted 4QFY2017 results better than expected. IT services revenues
came in US$1,955mn V/s US$1,937mn expected V/s US$1,903mn in 3QFY2017,
a 2.7% qoq growth, with a 1.7% qoq growth in constant Currency (CC). In rupee
terms, revenues grew by 2.6% qoq to `13,987cr V/s `13,561cr expected V/s
`13,688cr in 3QFY2017.
In terms of geography, the CC growth was USA (1.2% qoq), Europe (4.4% qoq),
India & Middle east (0.5% qoq), while APAC & Other Emerging markets (-0.7%
qoq). In terms of verticals, the CC growth was Manufacturing and Technology
(4.7% qoq), Finance Solutions (3.2% qoq), Consumer Business Unit (2.6% qoq),
Energy, Natural Resources & Utilities (1.9% qoq). The verticals which dipped was
Communications (-6.6% qoq) and Healthcare, Life Sciences & Services (-2.0%
qoq).
On the operating front, EBIT margin came in at 17.8% V/s 16.0% expected V/s
16.4% in 3QFY2017, an expansion of 180ps qoq. Thus, PAT came in at `2,267cr
V/s `2003cr expected V/s `2,109cr in 3QFY2017, up 7.5% qoq sequentially.
In terms of client additions, the company added one client in the US$75mn+, 1 in
the US$50mn+, one in the US$20mn+. On back of the Utilization, the company
had gross utilization of 73.1% v/s 71.6% in 3QFY2017. The attrition during the
quarter was 14.8% V/s 15.4% in 3QFY2017. Also company has announced a
bonus of 1:1.
For 1QFY2018, the company has guided for US$1,915-1,955mn, a qoq growth
of (2.0)-0% qoq band, which indicates a dim outlook for the 1QFY2018. However,
given the valuations, we maintain our buy rating with target price of `583.
Y/E
Sales OPM
PAT EPS ROE P/E P/BV EV/EBITDA EV/Sales
March
(` cr)
(%)
(` cr)
(`)
(%)
(x)
(x)
(x)
(x)
FY2017E
55,440
18.1
8,917
36.1
19.0
13.7
2.6
8.4
1.8
FY2018E
60,430
18.1
9,614
38.9
17.6
12.7
2.4
6.8
1.4
LIC Housing Finance
LIC Housing Finance came out with a good set of results for the quarter. NII grew
by 30.6% YoY, however there was a marginal rise in cost as a result pre
provisioning profit grew by 22.3% YoY. Though NII growth and PPP growth
remained strong provisions went up at a higher rate than the business growth and
hence PAT growth was at 18%. Loan book continued to see decent growth of 15%
YoY backed by noncore portfolio, where in lAP grew by a 65% and developer
loans grew by 60%. Though LIC housing has been growing its loan book at steady
pace it has been able to maintain a stable asset quality. Sequentially the asset
quality has improved and GNPAs % went down to 0.43% vs 0.56%. One of the key
positive during the quarter has been an improvement in the NIM which went up by
22 bps QoQ to 2.97%. We continue to have positive view on the Indian Housing
Finance Companies and have an ACCMULATE rating on the stock.
Market Outlook
April 26, 2017
Economic and Political News
Farm loan waivers like Yogi's announcement in UP to cost 2% of GDP: CEA
Serious action by US on H1-B visa would worry India quite a bit: CEA
India's wind power capacity crosses 32 GW mark, says IWTMA
Corporate News
Indian Bank profit up by `278.39 % in Q4
Can Fin Homes Q4 profit jumps 50% to `71cr
Mahindra Finance Q4 profit falls 37 per cent to `234cr
Quarterly Bloomberg Brokers Consensus Estimate
Axis Bank Ltd - Apr 26, 2017
Particulars ( ` cr)
4QFY17E
4QFY16
y-o-y (%)
3QFY17
q-o-q (%)
Net profit
803
2,154
(62.7)
580
38.6
Kotak Mahindra Bank Ltd - Apr 27, 2017
Particulars ( ` cr)
4QFY17E
4QFY16
y-o-y (%)
3QFY17
q-o-q (%)
Net profit
920
696
32.2
880
4.6
Reliance Capital Ltd Consol - April 27, 2017
Particulars ( ` cr)
4QFY17E
4QFY16
y-o-y (%)
3QFY17
q-o-q (%)
Net profit
377
415
(9.3)
209
80.4
Maruti Suzuki India Ltd - Apr 27, 2017
Particulars ( ` cr)
4QFY17E
4QFY16
y-o-y (%)
3QFY17
q-o-q (%)
Net sales
18,276
14,930
22.4
16,624
9.9
EBITDA
2,655
2,350
13.0
2,489
6.7
EBITDA margin (%)
14.5
15.7
15.0
Net profit
1,760
1,134
55.3
1,745
0.9
Federal Bank Ltd - Apr 28, 2017
Particulars ( ` cr)
4QFY17E
4QFY16
y-o-y (%)
3QFY17
q-o-q (%)
Net profit
227
10
2,113.9
206
10.5
Ambuja Cements Ltd - Apr 28, 2017
Particulars ( ` cr)
1QCY17E
1QCY16
y-o-y (%)
4QCY16
q-o-q (%)
Net sales
2,513
2,418
3.9
2,197
14.4
EBITDA
418
450
(7.0)
329
27.1
EBITDA margin (%)
16.6
18.6
15.0
Net profit
263
304
(13.5)
176
49.5
UPL Ltd Consol - Apr 28, 2017
Particulars ( ` cr)
4QFY17E
4QFY16
y-o-y (%)
3QFY17
q-o-q (%)
Net sales
4,897
4,292
14.1
3,855
27.1
EBITDA
1,135
981
15.7
750
51.3
EBITDA margin (%)
23.2
22.9
19.5
Net profit
665
560
18.7
459
44.8
Market Outlook
April 26, 2017
Top Picks ★★★★★
Market Cap
CMP
Target
Upside
Company
Rationale
(` Cr)
(`)
(`)
(%)
Strong growth in domestic business due to its leadership in
Alkem Laboratories
23,731
1,985
2,257
13.7
acute therapeutic segment. Alkem expects to launch more
products in USA, which bodes for its international business.
We expect the company would report strong profitability
Asian Granito
1,158
385
405
5.2
owing to better product mix, higher B2C sales and
amalgamation synergy..
Among the top 4 players in the consumer durables segment.
Bajaj Electricals
3,522
348
395
13.6
Improved profitability backed by turn around in E&P segment.
Strong order book lends earnings visibility.
Favourable outlook for the AC industry to augur well for
Cooling products business which is out pacing the market
Blue Star
6,472
677
760
12.2
growth. EMPPAC division's profitability to improve once
operating environment turns around..
With a focus on the low and medium income (LMI) consumer
Dewan Housing Finance
13,491
431
460
6.8
segment, the company has increased its presence in tier-II &
III cities where the growth opportunity is immense.
Strong loan growth backed by diversified loan portfolio and
adequate CAR. ROE & ROA likely to remain decent as risk of
Equitas Holdings
5,706
169
235
39.1
dilution remains low. Attractive valuations considering
growth.
Economic recovery to have favourable impact on advertising
& circulation revenue growth. Further, the acquisition of a
Jagran Prakashan
6,326
194
225
16.3
radio business (Radio City) would also boost the company's
revenue growth.
High order book execution in EPC segment, rising B2C sales
KEI Industries
1,650
212
239
12.4
and higher exports to boost the revenues and profitability
Speedier execution and speedier sales, strong revenue
Mahindra Lifespace
1,758
428
522
21.9
visibilty in short-to-long run, attractive valuations
Higher growth in domestic branded sales and healthy export
Mirza International
1,272
106
113
5.6
to boost the profitability.
Massive capacity expansion along with rail advantage at ICD
Navkar Corporation
3,065
215
265
23.3
as well CFS augurs well for the company
Strong brands and distribution network would boost growth
Siyaram Silk Mills
1,586
1,692
1,872
10.7
going ahead. Stock currently trades at an inexpensive
valuation.
Market leadership in Hindi news genre and no. 2 viewership
ranking in English news genre, exit from the radio business,
TV Today Network
1,632
274
344
25.7
and anticipated growth in ad spends by corporates to benefit
the stock.
Source: Company, Angel Research
Market Outlook
April 26, 2017
Key Upcoming Events
Result Calendar
Date
Company
Apr 26, 2017
KPIT Cummins
Apr 27, 2017
Maruti, TVS Motor, Kotak Mah. Bank, Shriram Trans.
Apr 28, 2017
CEAT, Ambuja Cements, IDFC, Federal Bank
May 1, 2017
Dabur India
May 3, 2017
ICICI Bank, Alembic Pharma
May 4, 2017
Exide Industries, MRF
May 5, 2017
Apollo Tyres, Visaka Industries, Aventis
May 6, 2017
L G Balakrishnan & Bros
Source: Bloomberg, Angel Research
Global economic events release calendar
Date
Time
Country
Event Description
Unit
Period
Bloomberg Data
Last Reported Estimated
Apr 27, 2017
2:30PM Euro Zone
Euro-Zone Consumer Confidence
Value
Apr F
(3.60)
(3.60)
6:00PM US
Initial Jobless claims
Thousands
Apr 22
244.00
245.00
5:15PM Euro Zone
ECB announces interest rates
%
Apr 27
--
--
Apr 28, 2017
6:30AM China
PMI Manufacturing
Value
Apr
51.80
51.70
6:00PM US
GDP Qoq (Annualised)
% Change
1Q A
2.10
1.00
Apr 30, 2017
2:00PM UK
GDP (YoY)
% Change
1Q A
1.90
2.20
May 2,, 2017 1:25PM Germany
PMI Manufacturing
Value
Apr F
58.20
--
2:00PM UK
PMI Manufacturing
Value
Apr
54.20
--
May 3,, 2017 1:25PM Germany
Unemployment change (000's)
Thousands
Apr
(30.00)
--
11:30PM US
FOMC rate decision
%
May 3
1.00
1.00
2:30PM Euro Zone
Euro-Zone GDP s.a. (QoQ)
% Change
1Q A
0.50
--
May 4,, 2017 1:25PM Germany
PMI Services
Value
Apr F
54.70
--
May 5,, 2017 6:00PM US
Change in Nonfarm payrolls
Thousands
Apr
98.00
180.00
6:00PM US
Unnemployment rate
%
Apr
4.50
4.60
May 8,, 2017
China
Exports YoY%
% Change
Apr
16.40
--
May 10, 2017
India
Imports YoY%
% Change
Apr
45.30
--
7:00AM China
Consumer Price Index (YoY)
% Change
Apr
0.90
--
India
Exports YoY%
% Change
Apr
27.60
--
May 11, 2017
US
Producer Price Index (mom)
% Change
Apr
(0.20)
--
2:00PM UK
Industrial Production (YoY)
% Change
Mar
2.80
--
4:30PM UK
BOE Announces rates
% Ratio
May 11
0.25
--
May 12, 2017 5:30PM India
Industrial Production YoY
% Change
Mar
(1.20)
--
6:00PM US
Consumer price index (mom)
% Change
Apr
(0.30)
0.20
11:30AM Germany
GDP nsa (YoY)
% Change
1Q P
1.20
--
May 15, 201712:00PM India
Monthly Wholesale Prices YoY%
% Change
Apr
5.70
--
6:00PM US
Housing Starts
Thousands
Apr
1,215.00
--
Source: Bloomberg, Angel Research
Market Outlook
April 26, 2017
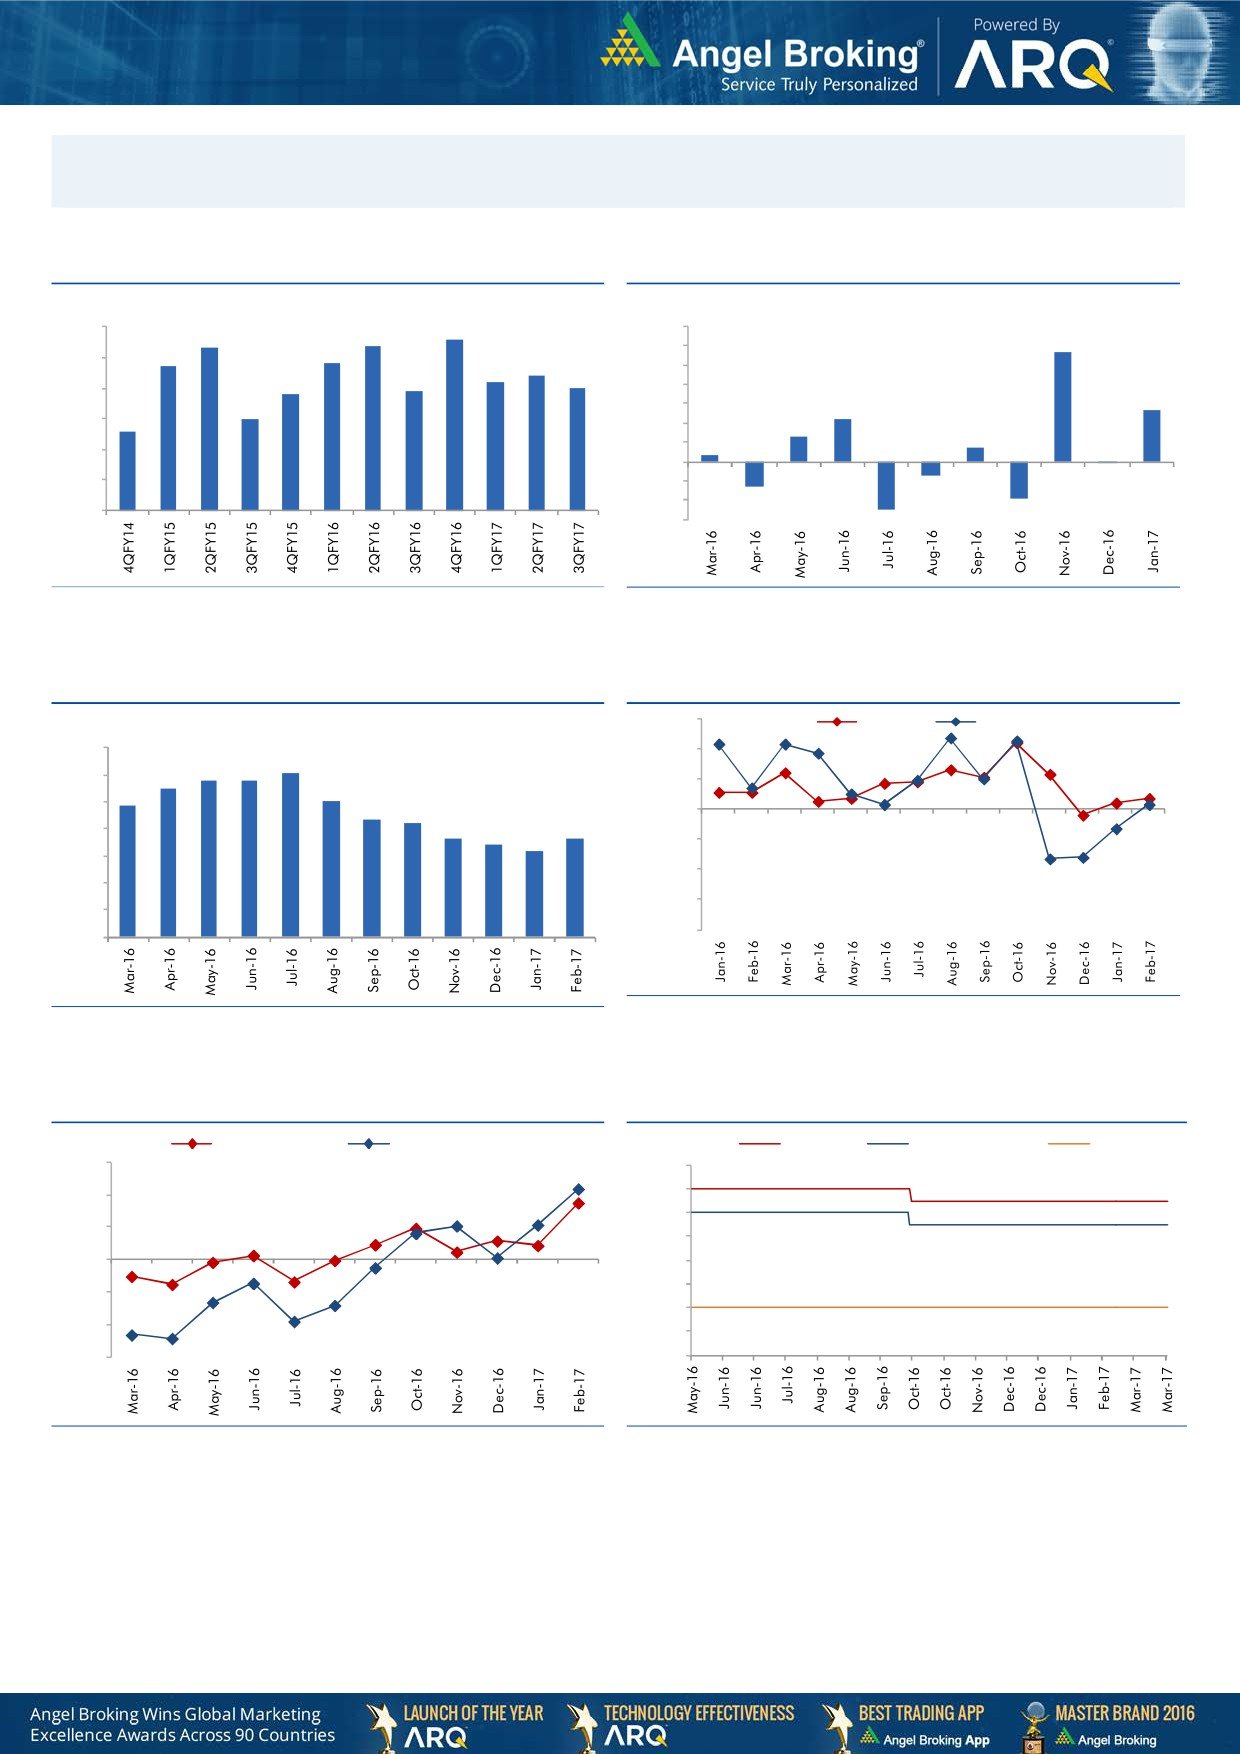
Macro watch
Exhibit 1: Quarterly GDP trends
Exhibit 2: IIP trends
(%)
(%)
9.0
8.4
8.6
7.0
8.3
5.7
7.7
7.8
6.0
8.0
7.4
7.2
5.0
6.8
6.9
7.0
7.0
4.0
2.7
6.0
3.0
2.2
6.0
5.6
1.3
2.0
0.7
1.0
0.3
5.0
-
4.0
(1.0)
(0.1)
(0.7)
(2.0)
3.0
(1.3)
(3.0)
(1.9)
(2.5)
Source: CSO, Angel Research
Source: MOSPI, Angel Research
Exhibit 3: Monthly CPI inflation trends
Exhibit 4: Manufacturing and services PMI
56.0
Mfg. PMI
Services PMI
(%)
7.0
54.0
6.1
5.8
5.8
6.0
5.5
5.1
52.0
4.8
5.0
4.3
4.2
50.0
3.6
3.7
4.0
3.4
3.2
48.0
3.0
46.0
2.0
44.0
1.0
42.0
-
Source: Market, Angel Research; Note: Level above 50 indicates expansion
Source: MOSPI, Angel Research
Exhibit 5: Exports and imports growth trends
Exhibit 6: Key policy rates
(%)
Exports yoy growth
Imports yoy growth
(%)
Repo rate
Reverse Repo rate
CRR
30.0
7.00
6.50
20.0
6.00
10.0
5.50
0.0
5.00
4.50
(10.0)
4.00
(20.0)
3.50
(30.0)
3.00
Source: Bloomberg, Angel Research
Source: RBI, Angel Research
Market Outlook
April 26, 2017
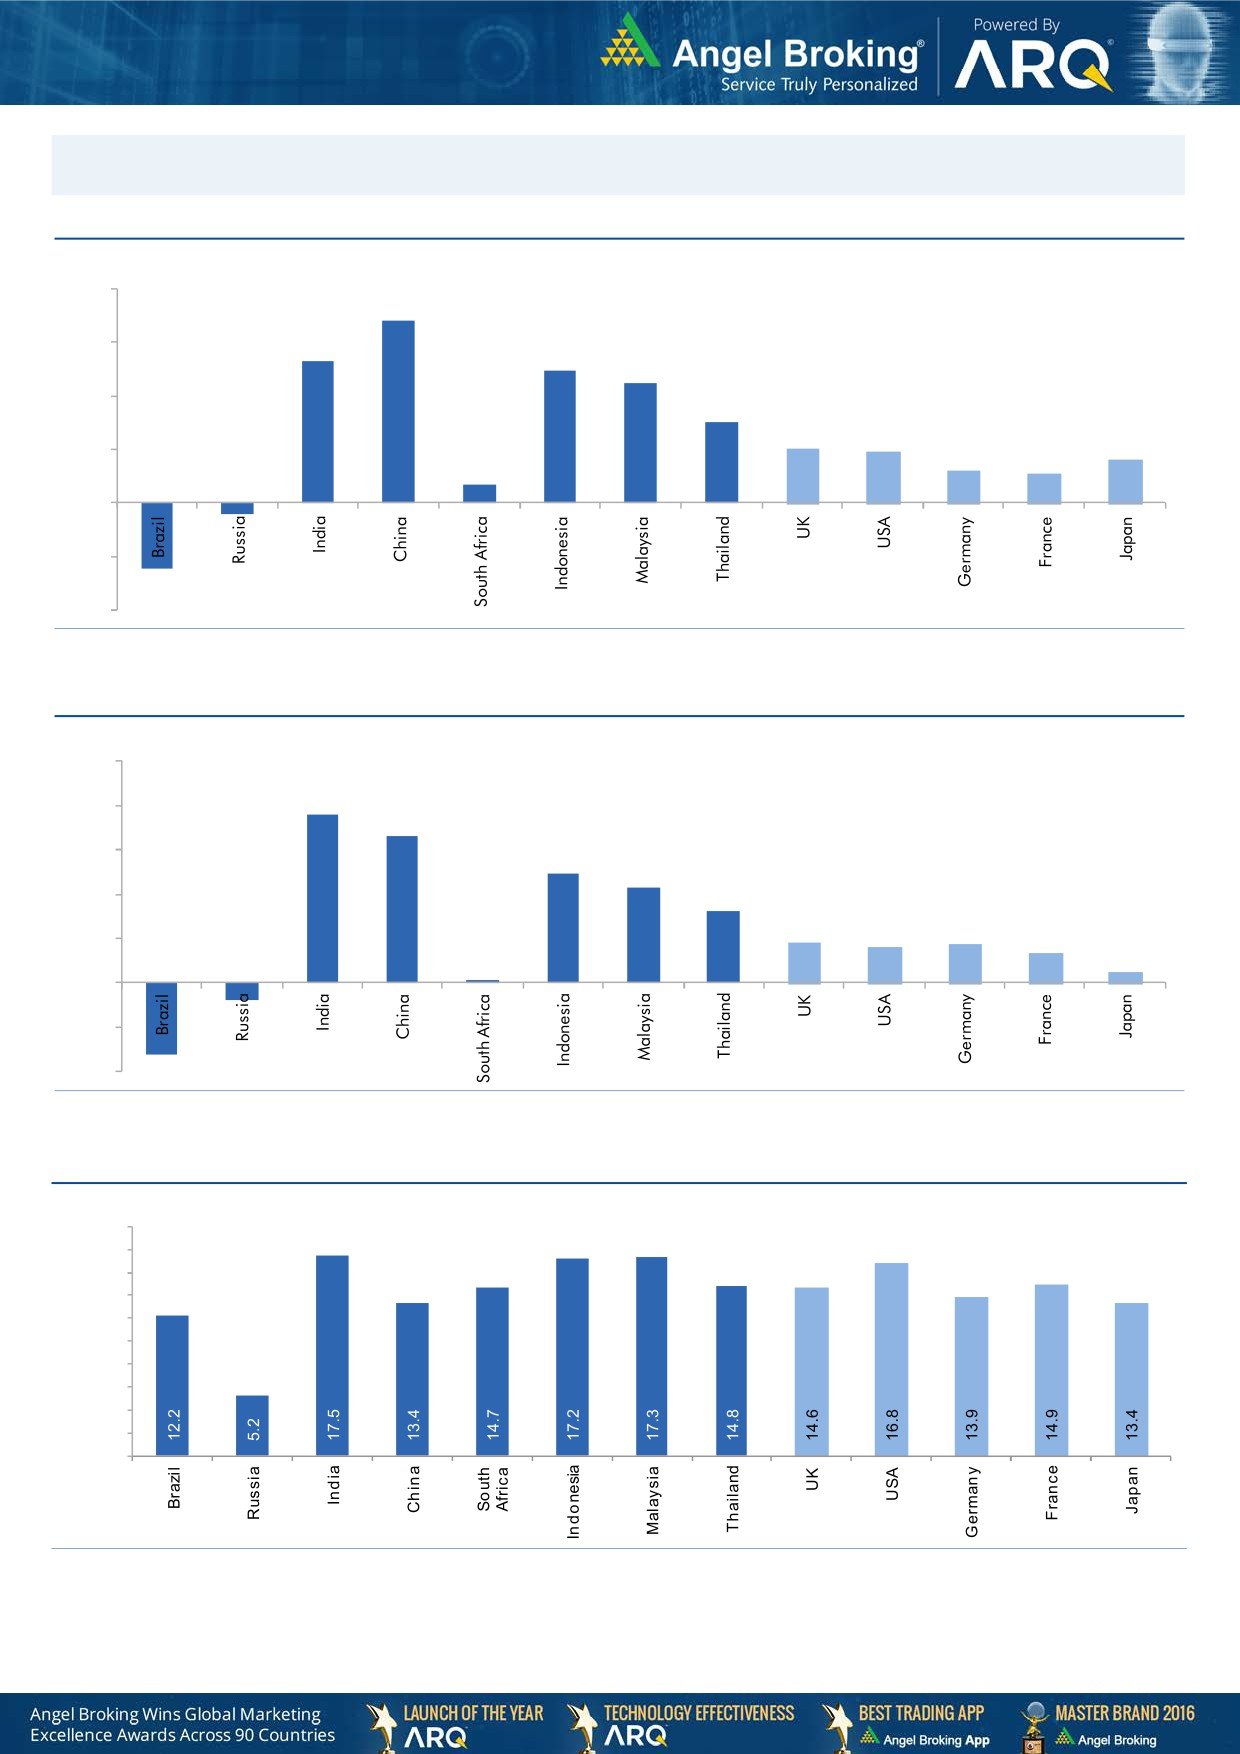
Global watch
Exhibit 1: Latest quarterly GDP Growth (%, yoy) across select developing and developed countries
(%)
8.0
6.8
6.0
5.3
4.9
0.7
4.5
4.0
3.0
2.0
1.9
2.0
1.2
1.6
1.1
-
(2.0)
(0.4)
(2.5)
(4.0)
Source: Bloomberg, Angel Research
Exhibit 2: 2016 GDP Growth projection by IMF (%, yoy) across select developing and developed countries
(%)
10.0
7.6
8.0
6.6
6.0
4.9
4.3
4.0
3.2
1.8
1.6
1.7
2.0
1.3
(0.8)
0.5
(3.3)
0.1
-
(2.0)
(4.0)
Source: IMF, Angel Research
Exhibit 3: One year forward P-E ratio across select developing and developed countries
(x)
20.0
18.0
16.0
14.0
12.0
10.0
8.0
6.0
4.0
2.0
-
Source: IMF, Angel Research
Market Outlook
April 26, 2017
Exhibit 4: Relative performance of indices across globe
Returns (%)
Country
Name of index
Closing price
1M
3M
1YR
Brazil
Bovespa
65,148
2.6
1.6
23.1
Russia
Micex
1,998
(2.0)
(6.9)
3.3
India
Nifty
9,307
3.1
10.6
17.6
China
Shanghai Composite
3,135
(3.6)
0.7
1.6
South Africa
Top 40
46,525
3.7
1.6
(0.7)
Mexico
Mexbol
49,808
2.7
7.7
8.4
Indonesia
LQ45
941
2.0
6.1
12.7
Malaysia
KLCI
1,766
1.1
6.1
3.2
Thailand
SET 50
993
(0.1)
2.5
14.4
USA
Dow Jones
20,996
1.6
6.0
16.7
UK
FTSE
7,276
(0.7)
1.7
15.1
Japan
Nikkei
19,079
(1.0)
1.6
13.2
Germany
DAX
12,467
4.7
8.0
23.2
France
CAC
5,278
5.7
9.5
22.1
Source: Bloomberg, Angel Research
Stock Watch
April 26, 2017
Company Name
Reco
CMP
Target
Mkt Cap
Sales ( Čcr )
OPM(%)
EPS (Č)
PER(x)
P/BV(x)
RoE(%)
EV/Sales(x)
(Č)
Price ( Č)
( Č cr )
FY17E
FY18E
FY17E
FY18E
FY17E
FY18E
FY17E
FY18E
FY17E
FY18E
FY17E
FY18E
FY17E
FY18E
Agri / Agri Chemical
Rallis
Neutral
240
-
4,659
1,937
2,164
13.3
14.3
9.0
11.0
26.6
21.8
4.6
4.1
18.4
19.8
2.5
2.2
United Phosphorus
Neutral
807
-
40,907
15,176
17,604
18.5
18.5
37.4
44.6
21.6
18.1
4.2
3.5
21.4
21.2
2.8
2.4
Auto & Auto Ancillary
Amara Raja Batteries
Accumulate
878
1,009
15,000
5,305
6,100
16.0
16.3
28.4
34.0
30.9
25.8
6.0
5.0
19.3
19.3
2.8
2.5
Apollo Tyres
Neutral
243
-
12,351
12,877
14,504
14.3
13.9
21.4
23.0
11.3
10.6
1.8
1.5
16.4
15.2
1.1
1.0
Ashok Leyland
Buy
88
111
25,072
20,021
21,915
11.6
11.9
4.5
5.3
19.6
16.6
4.0
3.6
20.6
21.5
1.2
1.1
Bajaj Auto
Neutral
2,896
-
83,812
25,093
27,891
19.5
19.2
143.9
162.5
20.1
17.8
5.7
4.9
30.3
29.4
3.1
2.7
Bharat Forge
Neutral
1,135
-
26,421
7,726
8,713
20.5
21.2
35.3
42.7
32.2
26.6
5.9
5.4
18.9
20.1
3.5
3.0
Ceat
Neutral
1,461
-
5,910
7,524
8,624
13.0
12.7
131.1
144.3
11.1
10.1
2.1
1.7
19.8
18.6
0.9
0.8
Eicher Motors
Neutral
26,082
-
70,971
16,583
20,447
17.5
18.0
598.0
745.2
43.6
35.0
14.9
11.4
41.2
38.3
4.1
3.3
Exide Industries
Neutral
235
-
20,001
7,439
8,307
15.0
15.0
8.1
9.3
29.1
25.3
4.1
3.6
14.3
16.7
2.3
2.1
Gabriel India
Neutral
126
-
1,812
1,544
1,715
9.0
9.3
5.4
6.3
23.4
20.0
4.4
3.9
18.9
19.5
1.1
1.0
Hero Motocorp
Neutral
3,306
-
66,014
28,083
30,096
15.3
15.7
171.8
187.0
19.2
17.7
6.7
5.6
30.1
27.9
2.2
2.0
Indag Rubber
Neutral
206
-
540
286
326
19.8
16.8
11.7
13.3
17.6
15.5
3.0
2.8
17.8
17.1
1.6
1.4
Jamna Auto Industries
Neutral
242
-
1,930
1,486
1,620
9.8
9.9
15.0
17.2
16.2
14.1
3.5
3.0
21.8
21.3
1.4
1.2
JK Tyres
Neutral
159
-
3,601
7,455
8,056
15.0
15.0
21.8
24.5
7.3
6.5
1.5
1.2
22.8
21.3
0.6
0.5
L G Balakrishnan & Bros Neutral
640
-
1,005
1,302
1,432
11.6
11.9
43.7
53.0
14.7
12.1
2.1
1.9
13.8
14.2
0.9
0.8
Mahindra and Mahindra Neutral
1,308
-
81,208
46,534
53,077
11.6
11.7
67.3
78.1
19.4
16.8
3.2
2.8
15.4
15.8
1.7
1.5
Maruti
Neutral
6,342
-
191,581
67,822
83,288
16.0
16.4
253.8
312.4
25.0
20.3
5.7
4.7
23.0
22.9
2.5
2.0
Minda Industries
Neutral
479
-
3,802
2,728
3,042
9.0
9.1
68.2
86.2
7.0
5.6
1.6
1.3
23.8
24.3
1.5
1.3
Motherson Sumi
Neutral
383
-
53,771
45,896
53,687
7.8
8.3
13.0
16.1
29.4
23.8
9.5
7.6
34.7
35.4
1.2
1.0
Rane Brake Lining
Neutral
1,014
-
803
511
562
11.3
11.5
28.1
30.9
36.1
32.8
5.5
5.0
15.3
15.0
1.7
1.6
Setco Automotive
Neutral
44
-
584
741
837
13.0
13.0
15.2
17.0
2.9
2.6
0.5
0.4
15.8
16.3
1.2
1.1
Subros
Neutral
232
-
1,390
1,488
1,681
11.7
11.9
6.4
7.2
36.2
32.3
3.8
3.5
10.8
11.4
1.2
1.0
Swaraj Engines
Neutral
1,665
-
2,067
660
810
15.2
16.4
54.5
72.8
30.5
22.9
9.5
8.6
31.5
39.2
3.0
2.4
Tata Motors
Neutral
446
-
128,660
300,209
338,549
8.9
8.4
42.7
54.3
10.4
8.2
1.7
1.4
15.6
17.2
0.5
0.5
TVS Motor
Neutral
489
-
23,229
13,390
15,948
6.9
7.1
12.8
16.5
38.3
29.6
9.5
7.6
26.3
27.2
1.8
1.5
Capital Goods
ACE
Neutral
66
-
648
709
814
4.1
4.6
1.4
2.1
46.8
31.2
1.9
1.8
4.4
6.0
1.1
0.9
BEML
Neutral
1,385
-
5,766
3,451
4,055
6.3
9.2
31.4
57.9
44.1
23.9
2.7
2.4
6.3
10.9
1.8
1.5
BGR Energy
Neutral
169
-
1,218
16,567
33,848
6.0
5.6
7.8
5.9
21.6
28.6
1.2
1.2
4.7
4.2
0.2
0.1
Stock Watch
April 26, 2017
Company Name
Reco
CMP
Target
Mkt Cap
Sales ( Čcr )
OPM(%)
EPS (Č)
PER(x)
P/BV(x)
RoE(%)
EV/Sales(x)
(Č)
Price ( Č)
( Č cr )
FY17E
FY18E
FY17E
FY18E
FY17E
FY18E
FY17E
FY18E
FY17E
FY18E
FY17E
FY18E
FY17E
FY18E
Capital Goods
Bharat Electronics
Neutral
180
-
40,261
8,137
9,169
16.8
17.2
58.7
62.5
3.1
2.9
0.5
0.4
44.6
46.3
3.9
3.5
BHEL
Neutral
178
-
43,531
28,797
34,742
-
2.8
2.3
6.9
77.3
25.8
1.3
1.3
1.3
4.8
1.2
0.9
Blue Star
Accumulate
677
760
6,472
4,283
5,077
5.9
7.3
14.9
22.1
45.5
30.6
8.8
7.4
20.4
26.4
1.6
1.3
CG Power and Industrial
Neutral
80
-
4,986
5,777
6,120
5.9
7.0
3.3
4.5
24.1
17.7
1.1
1.0
4.4
5.9
0.8
0.7
Solutions
Greaves Cotton
Neutral
168
-
4,109
1,755
1,881
16.8
16.9
7.8
8.5
21.6
19.8
4.3
4.0
20.6
20.9
2.0
1.9
Inox Wind
Neutral
198
-
4,386
5,605
6,267
15.7
16.4
24.8
30.0
8.0
6.6
2.2
1.6
25.9
24.4
0.8
0.7
KEC International
Neutral
218
-
5,612
9,294
10,186
7.9
8.1
9.9
11.9
22.1
18.3
3.2
2.8
15.6
16.3
0.8
0.8
KEI Industries
Accumulate
212
239
1,650
2,682
3,058
10.4
10.0
11.7
12.8
18.1
16.6
3.6
3.0
20.1
18.2
0.8
0.7
Thermax
Neutral
1,056
-
12,581
5,421
5,940
7.3
7.3
25.7
30.2
41.1
35.0
5.0
4.5
12.2
13.1
2.2
2.0
VATech Wabag
Neutral
695
-
3,792
3,136
3,845
8.9
9.1
26.0
35.9
26.7
19.4
3.3
2.9
13.4
15.9
1.1
0.9
Voltas
Neutral
417
-
13,800
6,511
7,514
7.9
8.7
12.9
16.3
32.3
25.6
5.8
5.1
16.7
18.5
1.9
1.6
Cement
ACC
Neutral
1,608
-
30,188
11,225
13,172
13.2
16.9
44.5
75.5
36.1
21.3
3.4
3.2
11.2
14.2
2.7
2.3
Ambuja Cements
Neutral
246
-
48,916
9,350
10,979
18.2
22.5
5.8
9.5
42.5
25.9
3.6
3.2
10.2
12.5
5.2
4.5
India Cements
Neutral
202
-
6,219
4,364
4,997
18.5
19.2
7.9
11.3
25.6
17.9
1.8
1.8
8.0
8.5
2.2
1.9
J K Lakshmi Cement
Neutral
485
-
5,702
2,913
3,412
14.5
19.5
7.5
22.5
64.6
21.5
4.0
3.3
12.5
18.0
2.5
2.1
JK Cement
Neutral
978
-
6,838
4,398
5,173
15.5
17.5
31.2
55.5
31.4
17.6
3.8
3.3
12.0
15.5
2.1
1.8
Orient Cement
Neutral
164
-
3,363
2,114
2,558
18.5
20.5
8.1
11.3
20.3
14.5
3.0
2.5
9.0
14.0
2.2
1.7
UltraTech Cement
Neutral
4,235
-
116,249
25,768
30,385
21.0
23.5
111.0
160.0
38.2
26.5
4.9
4.3
13.5
15.8
4.6
3.8
Construction
Engineers India
Neutral
171
-
11,490
1,725
1,935
16.0
19.1
11.4
13.9
15.0
12.3
2.1
2.0
13.4
15.3
5.6
5.0
Gujarat Pipavav Port
Neutral
158
-
7,646
705
788
52.2
51.7
5.0
5.6
31.6
28.2
3.1
2.8
11.2
11.2
10.5
8.9
ITNL
Neutral
117
-
3,846
8,946
10,017
31.0
31.6
8.1
9.1
14.4
12.9
0.5
0.5
4.2
5.0
3.8
3.5
KNR Constructions
Neutral
193
-
2,717
1,385
1,673
14.7
14.0
41.2
48.5
4.7
4.0
0.9
0.8
14.9
15.2
2.0
1.7
Larsen & Toubro
Neutral
1,746
-
162,945
111,017
124,908
11.0
11.0
61.1
66.7
28.6
26.2
3.4
3.2
13.1
12.9
2.5
2.3
MEP Infra
Neutral
64
-
1,045
1,877
1,943
30.6
29.8
3.0
4.2
21.4
15.3
10.4
7.0
0.6
0.6
1.9
1.8
Nagarjuna Const.
Neutral
100
-
5,543
8,842
9,775
9.1
8.8
5.3
6.4
18.8
15.6
1.5
1.4
8.2
9.1
0.8
0.7
NBCC
Neutral
193
-
17,334
7,428
9,549
7.9
8.6
8.2
11.0
23.5
17.5
1.2
0.9
28.2
28.7
2.0
1.5
PNC Infratech
Neutral
163
-
4,188
2,350
2,904
13.1
13.2
9.0
8.8
18.1
18.6
0.7
0.6
15.9
13.9
1.9
1.5
Power Mech Projects
Neutral
558
-
821
1,801
2,219
12.7
14.6
72.1
113.9
7.7
4.9
1.4
1.2
16.8
11.9
0.5
0.3
Sadbhav Engineering
Neutral
329
-
5,641
3,598
4,140
10.3
10.6
9.0
11.9
36.5
27.6
3.8
3.4
9.9
11.9
1.9
1.6
Stock Watch
April 26, 2017
Company Name
Reco
CMP
Target
Mkt Cap
Sales ( Čcr )
OPM(%)
EPS (Č)
PER(x)
P/BV(x)
RoE(%)
EV/Sales(x)
(Č)
Price ( Č)
( Č cr )
FY17E
FY18E
FY17E
FY18E
FY17E
FY18E
FY17E
FY18E
FY17E
FY18E
FY17E
FY18E
FY17E
FY18E
Construction
Simplex Infra
Neutral
397
-
1,962
6,829
7,954
10.5
10.5
31.4
37.4
12.6
10.6
1.3
1.2
9.9
13.4
0.7
0.6
SIPL
Neutral
103
-
3,614
1,036
1,252
65.5
66.2
(8.4)
(5.6)
3.8
4.4
(22.8)
(15.9)
11.7
9.7
Financials
Axis Bank
Accumulate
515
580
123,405
46,932
53,575
3.5
3.4
32.4
44.6
15.9
11.5
2.1
1.8
13.6
16.5
-
-
Bank of Baroda
Neutral
182
-
41,913
19,980
23,178
1.8
1.8
11.5
17.3
15.8
10.5
1.8
1.5
8.3
10.1
-
-
Can Fin Homes
Neutral
2,584
-
6,880
420
526
3.5
3.5
86.5
107.8
29.9
24.0
6.4
5.3
23.6
24.1
-
-
Canara Bank
Neutral
332
-
19,809
15,225
16,836
1.8
1.8
14.5
28.0
22.9
11.8
1.6
1.3
5.8
8.5
-
-
Cholamandalam Inv. &
Accumulate
1,106
1,230
17,277
2,012
2,317
6.3
6.3
42.7
53.6
25.9
20.6
4.1
3.5
16.9
18.3
-
-
Fin. Co.
Dewan Housing Finance Accumulate
431
460
13,491
2,225
2,688
2.9
2.9
29.7
34.6
14.5
12.5
2.3
1.5
16.1
14.8
-
-
Equitas Holdings
Buy
169
235
5,706
939
1,281
11.7
11.5
5.8
8.2
29.1
20.6
2.5
2.2
10.9
11.5
-
-
Federal Bank
Buy
94
115
16,188
8,259
8,995
3.0
3.0
4.3
5.6
21.9
16.8
1.9
1.7
8.5
10.1
-
-
HDFC
Neutral
1,548
-
245,989
11,475
13,450
3.4
3.4
45.3
52.5
34.2
29.5
6.6
5.8
20.2
20.5
-
-
HDFC Bank
Accumulate
1,536
1,650
393,658
46,097
55,433
4.5
4.5
58.4
68.0
26.3
22.6
4.6
3.9
18.8
18.6
-
-
ICICI Bank
Buy
273
315
158,770
42,800
44,686
3.1
3.3
18.0
21.9
15.1
12.5
2.1
1.9
11.1
12.3
-
-
Karur Vysya Bank
Buy
118
140
7,146
5,640
6,030
3.3
3.2
8.9
10.0
13.3
11.8
1.4
1.3
11.2
11.4
-
-
Lakshmi Vilas Bank
Neutral
198
-
3,796
3,339
3,799
2.7
2.8
11.0
14.0
18.0
14.2
1.9
1.7
11.2
12.7
-
-
LIC Housing Finance
Neutral
673
-
33,969
3,712
4,293
2.6
2.5
39.0
46.0
17.3
14.6
3.2
2.8
19.9
20.1
-
-
Punjab Natl.Bank
Neutral
161
-
34,282
23,532
23,595
2.3
2.4
6.8
12.6
23.7
12.8
3.7
2.6
3.3
6.5
-
-
RBL Bank
Neutral
568
-
21,003
1,783
2,309
2.6
2.6
12.7
16.4
44.7
34.6
4.9
4.4
12.8
13.3
-
-
Repco Home Finance
Accumulate
766
825
4,792
388
457
4.5
4.2
30.0
38.0
25.5
20.2
4.3
3.6
18.0
19.2
-
-
South Ind.Bank
Neutral
25
-
4,489
6,435
7,578
2.5
2.5
2.7
3.1
9.2
8.0
1.2
1.0
10.1
11.2
-
-
St Bk of India
Neutral
286
-
231,942
88,650
98,335
2.6
2.6
13.5
18.8
21.2
15.2
2.0
1.8
7.0
8.5
-
-
Union Bank
Neutral
163
-
11,205
13,450
14,925
2.3
2.3
25.5
34.5
6.4
4.7
0.9
0.8
7.5
10.2
-
-
Yes Bank
Neutral
1,557
-
71,070
8,978
11,281
3.3
3.4
74.0
90.0
21.0
17.3
4.0
3.4
17.0
17.2
-
-
FMCG
Akzo Nobel India
Neutral
2,037
-
9,769
2,955
3,309
13.3
13.7
57.2
69.3
35.6
29.4
11.6
9.8
32.7
33.3
3.1
2.7
Asian Paints
Neutral
1,097
-
105,229
17,128
18,978
16.8
16.4
19.1
20.7
57.4
53.0
20.0
18.9
34.8
35.5
6.1
5.5
Britannia
Neutral
3,477
-
41,718
9,594
11,011
14.6
14.9
80.3
94.0
43.3
37.0
17.8
13.8
41.2
-
4.2
3.6
Colgate
Neutral
1,037
-
28,204
4,605
5,149
23.4
23.4
23.8
26.9
43.6
38.6
24.1
18.9
64.8
66.8
6.1
5.4
Dabur India
Neutral
294
-
51,718
8,315
9,405
19.8
20.7
8.1
9.2
36.3
31.9
10.1
8.4
31.6
31.0
5.9
5.2
GlaxoSmith Con*
Neutral
5,223
-
21,965
4,350
4,823
21.2
21.4
179.2
196.5
29.2
26.6
7.7
6.6
27.1
26.8
4.4
3.9
Stock Watch
April 26, 2017
Company Name
Reco
CMP
Target
Mkt Cap
Sales ( Čcr )
OPM(%)
EPS (Č)
PER(x)
P/BV(x)
RoE(%)
EV/Sales(x)
(Č)
Price ( Č)
( Č cr )
FY17E FY18E
FY17E
FY18E
FY17E
FY18E
FY17E
FY18E
FY17E
FY18E
FY17E
FY18E
FY17E
FY18E
FMCG
Godrej Consumer
Neutral
1,750
-
59,607
10,235
11,428
18.4
18.6
41.1
44.2
42.6
39.6
9.4
8.0
24.9
24.8
5.9
5.2
HUL
Neutral
924
-
199,997
35,252
38,495
17.8
17.8
20.7
22.4
44.8
41.3
42.8
36.7
95.6
88.9
5.5
5.0
ITC
Neutral
281
-
341,584
40,059
44,439
38.3
39.2
9.0
10.1
31.3
27.8
8.7
7.6
27.8
27.5
8.0
7.2
Marico
Neutral
311
-
40,153
6,430
7,349
18.8
19.5
6.4
7.7
48.6
40.4
14.7
12.4
33.2
32.5
6.1
5.2
Nestle*
Neutral
6,325
-
60,985
10,073
11,807
20.7
21.5
124.8
154.2
50.7
41.0
20.8
18.7
34.8
36.7
5.9
5.0
Procter & Gamble
Neutral
7,350
-
23,859
2,939
3,342
23.2
23.0
146.2
163.7
50.3
44.9
12.7
10.6
25.3
23.5
7.7
6.7
Hygiene
Tata Global
Neutral
152
-
9,574
8,675
9,088
9.8
9.8
7.4
8.2
20.5
18.5
1.6
1.5
7.9
8.1
1.0
1.0
IT
HCL Tech^
Buy
819
1,000
116,918
49,242
57,168
20.5
20.5
55.7
64.1
14.7
12.8
3.0
2.3
20.3
17.9
2.2
1.8
Infosys
Buy
929
1,179
213,386
68,484
73,963
26.0
26.0
63.0
64.0
14.8
14.5
3.1
2.8
20.8
19.7
2.8
2.5
TCS
Accumulate
2,311
2,651
455,425
117,966
127,403
27.5
27.6
134.3
144.5
17.2
16.0
5.1
4.8
29.8
29.7
3.5
3.3
Tech Mahindra
Buy
438
600
42,636
29,673
32,937
15.5
17.0
32.8
39.9
13.3
11.0
2.6
2.3
19.6
20.7
1.2
1.0
Wipro
Buy
495
583
120,268
55,440
60,430
18.1
18.1
36.1
38.9
13.7
12.7
2.5
2.3
19.0
17.6
1.9
1.7
Media
D B Corp
Neutral
383
-
7,035
2,297
2,590
27.4
28.2
21.0
23.4
18.2
16.4
4.3
3.7
23.7
23.1
2.9
2.5
Hindustan Media
Neutral
293
-
2,150
1,016
1,138
24.3
25.2
27.3
30.1
10.7
9.7
2.0
1.8
16.2
15.8
1.4
1.3
Ventures
HT Media
Neutral
83
-
1,936
2,693
2,991
12.6
12.9
7.9
9.0
10.5
9.2
0.9
0.8
7.8
8.3
0.3
0.2
Jagran Prakashan
Buy
194
225
6,326
2,355
2,635
28.0
28.0
10.8
12.5
17.9
15.5
3.9
3.4
21.7
21.7
2.7
2.4
Sun TV Network
Neutral
928
-
36,569
2,850
3,265
70.1
71.0
26.2
30.4
35.4
30.5
9.1
8.0
24.3
25.6
12.4
10.7
TV Today Network
Buy
274
344
1,632
567
645
26.7
27.0
15.4
18.1
17.8
15.1
2.7
2.3
14.9
15.2
2.4
2.1
Metals & Mining
Coal India
Neutral
278
-
172,783
84,638
94,297
21.4
22.3
24.5
27.1
11.4
10.3
4.7
4.5
42.6
46.0
1.6
1.4
Hind. Zinc
Neutral
273
-
115,161
14,252
18,465
55.9
48.3
15.8
21.5
17.3
12.7
2.8
2.5
17.0
20.7
8.1
6.2
Hindalco
Neutral
192
-
43,004
107,899
112,095
7.4
8.2
9.2
13.0
20.8
14.8
1.0
1.0
4.8
6.6
0.9
0.9
JSW Steel
Neutral
195
-
47,039
53,201
58,779
16.1
16.2
130.6
153.7
1.5
1.3
0.2
0.2
14.0
14.4
1.6
1.4
NMDC
Neutral
131
-
41,384
6,643
7,284
44.4
47.7
7.1
7.7
18.4
17.0
1.6
1.6
8.8
9.2
4.0
3.6
SAIL
Neutral
61
-
25,008
47,528
53,738
(0.7)
2.1
(1.9)
2.6
23.3
0.7
0.6
(1.6)
3.9
1.4
1.2
Tata Steel
Neutral
454
-
44,088
121,374
121,856
7.2
8.4
18.6
34.3
24.4
13.2
1.5
1.4
6.1
10.1
1.0
1.0
Vedanta
Neutral
235
-
69,774
71,744
81,944
19.2
21.7
13.4
20.1
17.6
11.7
1.5
1.4
8.4
11.3
1.4
1.1
Oil & Gas
Cairn India
Neutral
285
-
53,538
9,127
10,632
4.3
20.6
8.8
11.7
32.4
24.4
1.0
1.0
3.3
4.2
7.3
6.1
GAIL
Neutral
412
-
69,614
56,220
65,198
9.3
10.1
27.1
33.3
15.2
12.4
1.4
1.3
9.3
10.7
1.4
1.2
Indian Oil Corp
Neutral
437
-
211,960
373,359
428,656
5.9
5.5
54.0
59.3
8.1
7.4
1.3
1.1
16.0
15.6
0.7
0.6
Stock Watch
April 26, 2017
Company Name
Reco
CMP
Target
Mkt Cap
Sales ( Čcr )
OPM(%)
EPS (Č)
PER(x)
P/BV(x)
RoE(%)
EV/Sales(x)
(Č)
Price ( Č)
( Č cr )
FY17E FY18E
FY17E
FY18E
FY17E
FY18E
FY17E
FY18E
FY17E
FY18E
FY17E
FY18E
FY17E
FY18E
Oil & Gas
ONGC
Neutral
182
-
232,923
137,222
152,563
15.0
21.8
19.5
24.1
9.3
7.5
0.8
0.8
8.5
10.1
2.0
1.8
Reliance Industries
Neutral
1,433
-
465,753
301,963
358,039
12.1
12.6
87.7
101.7
16.3
14.1
1.7
1.5
10.7
11.3
2.0
1.7
Pharmaceuticals
Alembic Pharma
Accumulate
611
689
11,521
3,483
4,244
20.2
21.4
24.3
33.6
25.2
18.2
5.7
4.6
25.5
25.3
3.2
2.6
Alkem Laboratories Ltd
Accumulate
1,985
2,257
23,731
6,065
7,009
18.7
20.0
80.2
92.0
24.8
21.6
5.6
4.7
22.5
21.6
3.9
3.3
Aurobindo Pharma
Buy
624
877
36,553
15,720
18,078
23.7
23.7
41.4
47.3
15.1
13.2
3.9
3.1
29.6
26.1
2.5
2.2
Aventis*
Neutral
4,259
-
9,810
2,277
2,597
16.6
17.4
128.9
157.0
33.0
27.1
5.6
4.3
21.6
26.4
4.1
3.4
Cadila Healthcare
Neutral
457
-
46,816
10,429
12,318
17.7
21.6
13.1
19.2
34.9
23.8
7.3
5.8
22.8
27.1
4.5
3.7
Cipla
Sell
553
465
44,477
15,378
18,089
15.7
16.8
19.3
24.5
28.7
22.6
3.4
3.0
12.3
13.9
3.1
2.6
Dishman Pharma
Sell
327
143
5,279
1,718
1,890
22.7
22.8
9.5
11.3
34.4
29.0
3.3
3.0
10.1
10.9
3.5
3.1
Dr Reddy's
Neutral
2,646
-
43,833
16,043
18,119
18.0
23.0
78.6
130.9
33.7
20.2
3.3
2.9
10.1
15.2
2.5
2.4
GSK Pharma*
Neutral
2,567
-
21,745
2,800
3,290
10.2
20.6
32.2
60.3
79.7
42.6
14.8
14.6
17.2
34.5
7.5
6.5
Indoco Remedies
Accumulate
228
240
2,099
1,112
1,289
16.2
18.2
11.6
16.0
19.6
14.2
3.1
2.6
17.0
20.1
2.0
1.7
Ipca labs
Neutral
594
-
7,500
3,258
3,747
12.8
15.3
12.1
19.2
49.1
31.0
3.1
2.8
6.4
9.5
2.4
2.1
Lupin
Buy
1,377
1,809
62,169
15,912
18,644
26.4
26.7
58.1
69.3
23.7
19.9
4.6
3.8
21.4
20.9
4.0
3.3
Natco Pharma
Accumulate
925
974
16,116
2,090
2,335
32.1
26.6
26.8
23.2
34.5
39.9
9.8
8.4
28.4
21.1
7.8
95.5
Sun Pharma
Buy
643
847
154,151
31,129
35,258
32.0
32.9
30.2
35.3
21.3
18.2
3.5
2.9
20.0
20.1
4.5
3.8
Power
NTPC
Neutral
166
-
136,627
86,605
95,545
17.5
20.8
11.8
13.4
14.0
12.4
1.4
1.3
10.5
11.1
2.9
2.9
Power Grid
Accumulate
208
223
108,791
25,315
29,193
88.2
88.7
14.2
17.2
14.7
12.1
2.2
2.0
15.2
16.1
8.9
8.0
Tata Power
Neutral
85
-
23,045
36,916
39,557
17.4
27.1
5.1
6.3
16.7
13.5
1.5
1.4
9.0
10.3
1.6
1.5
Real Estate
MLIFE
Buy
428
522
1,758
1,152
1,300
22.7
24.6
29.9
35.8
14.3
12.0
1.1
1.0
7.6
8.6
2.2
1.9
Prestige Estate
Neutral
267
-
10,028
4,707
5,105
25.2
26.0
10.3
13.0
26.0
20.6
2.1
1.9
10.3
10.2
3.3
2.9
Telecom
Bharti Airtel
Neutral
354
-
141,568
105,086
114,808
34.5
34.7
12.2
16.4
29.0
21.6
2.0
1.8
6.8
8.4
2.3
2.0
Idea Cellular
Neutral
85
-
30,681
40,133
43,731
37.2
37.1
6.4
6.5
13.3
13.1
1.1
1.0
8.2
7.6
1.8
1.5
zOthers
Abbott India
Neutral
4,446
-
9,447
3,153
3,583
14.1
14.4
152.2
182.7
29.2
24.3
143.4
122.5
25.6
26.1
2.7
2.3
Asian Granito
Accumulate
385
405
1,158
1,060
1,169
12.2
12.5
12.7
15.9
30.4
24.2
2.9
2.6
9.5
10.7
1.4
1.2
Bajaj Electricals
Accumulate
348
395
3,522
4,801
5,351
5.7
6.2
10.4
13.7
33.4
25.4
4.1
3.7
12.4
14.5
0.7
0.7
Banco Products (India)
Neutral
233
-
1,666
1,353
1,471
12.3
12.4
14.5
16.3
16.1
14.3
22.2
20.0
14.5
14.6
1.2
126.0
Coffee Day Enterprises
Neutral
248
-
5,116
2,964
3,260
20.5
21.2
4.7
8.0
-
31.0
2.9
2.6
5.5
8.5
2.1
1.9
Ltd
Competent Automobiles Neutral
235
-
151
1,137
1,256
3.1
2.7
28.0
23.6
8.4
10.0
45.2
40.9
14.3
11.5
0.1
0.1
Stock Watch
April 26, 2017
Company Name
Reco
CMP
Target
Mkt Cap
Sales ( Čcr )
OPM(%)
EPS (Č)
PER(x)
P/BV(x)
RoE(%)
EV/Sales(x)
(Č)
Price ( Č)
( Č cr )
FY17E
FY18E
FY17E
FY18E
FY17E
FY18E
FY17E
FY18E
FY17E
FY18E
FY17E
FY18E
FY17E
FY18E
zOthers
Elecon Engineering
Neutral
63
-
704
1,482
1,660
13.7
14.5
3.9
5.8
16.1
10.8
3.8
3.5
7.8
10.9
0.8
0.7
Finolex Cables
Neutral
538
-
8,231
2,883
3,115
12.0
12.1
14.2
18.6
37.9
28.9
20.2
17.6
15.8
14.6
2.5
2.3
Garware Wall Ropes
Neutral
746
-
1,632
863
928
15.1
15.2
36.4
39.4
20.5
18.9
3.7
3.2
17.5
15.9
1.8
1.7
Goodyear India*
Neutral
917
-
2,115
1,598
1,704
10.4
10.2
49.4
52.6
18.6
17.4
85.7
75.2
18.2
17.0
1.0
144.4
Hitachi
Neutral
1,795
-
4,880
2,081
2,433
8.8
8.9
33.4
39.9
53.7
45.0
43.4
36.1
22.1
21.4
2.3
2.0
HSIL
Neutral
346
-
2,505
2,384
2,515
15.8
16.3
15.3
19.4
22.6
17.9
22.5
19.4
7.8
9.3
1.2
1.1
Interglobe Aviation
Neutral
1,110
-
40,132
21,122
26,005
14.5
27.6
110.7
132.1
10.0
8.4
60.0
42.9
168.5
201.1
1.9
1.5
Jyothy Laboratories
Neutral
398
-
7,228
1,440
2,052
11.5
13.0
8.5
10.0
46.8
39.8
11.3
10.5
18.6
19.3
5.3
3.7
Kirloskar Engines India
Neutral
395
-
5,712
2,554
2,800
9.9
10.0
10.5
12.1
37.6
32.6
15.7
14.9
10.7
11.7
1.9
1.7
Ltd
Linc Pen & Plastics
Neutral
300
-
444
382
420
9.3
9.5
13.5
15.7
22.3
19.1
3.8
3.3
17.1
17.3
1.2
1.1
M M Forgings
Neutral
613
-
740
546
608
20.4
20.7
41.3
48.7
14.9
12.6
84.0
74.3
16.6
17.0
1.2
1.1
Manpasand Bever.
Neutral
710
-
4,062
836
1,087
19.6
19.4
16.9
23.8
42.0
29.8
5.0
4.4
12.0
14.8
4.6
3.5
Mirza International
Neutral
106
-
1,275
963
1,069
17.2
18.0
6.1
7.5
17.3
14.1
2.6
2.2
15.0
15.7
1.5
1.4
MT Educare
Neutral
83
-
331
366
417
17.7
18.2
9.4
10.8
8.9
7.7
2.0
1.7
22.2
22.3
0.8
0.7
Narayana Hrudaya
Neutral
317
-
6,477
1,873
2,166
11.5
11.7
2.6
4.0
119.8
79.9
7.4
6.6
6.1
8.3
3.6
3.1
Navkar Corporation
Buy
215
265
3,065
369
561
42.9
42.3
6.9
11.5
31.1
18.7
2.2
2.0
7.4
10.5
9.3
6.1
Navneet Education
Neutral
169
-
3,941
1,062
1,147
24.0
24.0
6.1
6.6
27.7
25.5
5.7
5.0
20.6
19.8
3.8
3.5
Nilkamal
Neutral
2,196
-
3,277
1,995
2,165
10.7
10.4
69.8
80.6
31.5
27.2
125.5
109.0
16.6
16.5
1.6
1.5
Page Industries
Neutral
14,156
-
15,789
2,450
3,124
20.1
17.6
299.0
310.0
47.3
45.7
315.3
240.7
47.1
87.5
6.5
5.1
Parag Milk Foods
Neutral
247
-
2,077
1,919
2,231
9.3
9.6
9.5
12.9
26.1
19.1
4.1
3.4
15.5
17.5
1.2
1.1
Quick Heal
Neutral
248
-
1,736
408
495
27.3
27.0
7.7
8.8
32.0
28.2
3.0
3.0
9.3
10.6
3.4
2.8
Radico Khaitan
Buy
124
147
1,645
1,667
1,824
13.0
13.2
6.7
8.2
18.6
15.1
1.7
1.5
9.0
10.2
1.4
1.2
Relaxo Footwears
Neutral
494
-
5,939
2,085
2,469
9.2
8.2
7.6
8.0
65.4
62.2
25.4
21.6
17.9
18.8
2.9
2.5
S H Kelkar & Co.
Neutral
324
-
4,678
1,036
1,160
15.1
15.0
6.1
7.2
53.0
45.1
5.7
5.2
10.7
11.5
4.4
3.9
Siyaram Silk Mills
Accumulate
1,692
1,872
1,586
1,652
1,857
11.6
11.7
92.4
110.1
18.3
15.4
2.7
2.3
14.7
15.2
1.2
1.0
Styrolution ABS India*
Neutral
751
-
1,320
1,440
1,537
9.2
9.0
40.6
42.6
18.5
17.6
47.2
42.9
12.3
11.6
0.9
0.8
Surya Roshni
Neutral
212
-
928
3,342
3,625
7.8
7.5
17.3
19.8
12.3
10.7
23.3
18.7
10.5
10.8
0.5
0.5
Team Lease Serv.
Neutral
1,083
-
1,852
3,229
4,001
1.5
1.8
22.8
32.8
47.6
33.0
5.1
4.4
10.7
13.4
0.5
0.4
The Byke Hospitality
Neutral
209
-
838
287
384
20.5
20.5
7.6
10.7
27.5
19.5
5.7
4.7
20.7
23.5
2.9
2.2
Stock Watch
April 26, 2017
Company Name
Reco
CMP
Target Mkt Cap
Sales ( Čcr )
OPM(%)
EPS (Č)
PER(x)
P/BV(x)
RoE(%)
EV/Sales(x)
(Č)
Price ( Č)
( Č cr )
FY17E FY18E FY17E FY18E FY17E FY18E FY17E FY18E FY17E FY18E FY17E FY18E FY17E FY18E
zOthers
Transport Corporation of
Neutral
236
-
1,804
2,671
2,911
8.5
8.8
13.9
15.7
17.0
15.1
2.3
2.1
13.7
13.8
0.8
0.7
India
TVS Srichakra
Neutral
3,899
-
2,985
2,304
2,614
13.7
13.8
231.1
266.6
16.9
14.6
438.1
345.0
33.9
29.3
1.3
1.1
UFO Moviez
Neutral
445
-
1,229
619
685
33.2
33.4
30.0
34.9
14.9
12.8
2.1
1.8
13.8
13.9
1.7
1.4
Visaka Industries
Neutral
310
-
492
1,051
1,138
10.3
10.4
21.0
23.1
14.8
13.4
39.7
37.2
9.0
9.2
0.7
0.7
VRL Logistics
Neutral
345
-
3,151
1,902
2,119
16.7
16.6
14.6
16.8
23.7
20.5
5.2
4.6
21.9
22.2
1.8
1.6
Wonderla Holidays
Neutral
393
-
2,223
287
355
38.0
40.0
11.3
14.2
34.8
27.7
5.0
4.4
21.4
23.9
7.4
6.0
VIP Industries
Accumulate
201
218
2,845
1,270
1,450
10.4
10.4
5.6
6.5
36.0
31.0
7.5
6.5
20.7
21.1
2.2
2.0
Navin Fluorine
Accumulate
3,215
3,650
3,148
789
945
21.1
22.4
120.1
143.4
26.8
22.4
4.3
3.7
17.8
18.5
3.9
3.2
Source: Company, Angel Research; Note: *December year end; #September year end; &October year end; Price as on April 25, 2017
Market Outlook
April 26, 2017
Research Team Tel: 022 - 39357800
DISCLAIMER
Angel Broking Private Limited (hereinafter referred to as “Angel”) is a registered Member of National Stock Exchange of India
Limited,Bombay Stock Exchange Limited and Metropolitan Stock Exchange Limited. It is also registered as a Depository Participant with
CDSL and Portfolio Manager with SEBI. It also has registration with AMFI as a Mutual Fund Distributor. Angel Broking Private Limited is a
registered entity with SEBI for Research Analyst in terms of SEBI (Research Analyst) Regulations, 2014 vide registration number
INH000000164. Angel or its associates has not been debarred/ suspended by SEBI or any other regulatory authority for accessing
/dealing in securities Market. Angel or its associates/analyst has not received any compensation / managed or
co-managed public offering of securities of the company covered by Analyst during the past twelve months.
This document is solely for the personal information of the recipient, and must not be singularly used as the basis of any investment
decision. Nothing in this document should be construed as investment or financial advice. Each recipient of this document should make
such investigations as they deem necessary to arrive at an independent evaluation of an investment in the securities of the companies
referred to in this document (including the merits and risks involved), and should consult their own advisors to determine the merits and
risks of such an investment.
Reports based on technical and derivative analysis center on studying charts of a stock's price movement, outstanding positions and
trading volume, as opposed to focusing on a company's fundamentals and, as such, may not match with a report on a company's
fundamentals. Investors are advised to refer the Fundamental and Technical Research Reports available on our website to evaluate the
contrary view, if any.
The information in this document has been printed on the basis of publicly available information, internal data and other reliable
sources believed to be true, but we do not represent that it is accurate or complete and it should not be relied on as such, as this
document is for general guidance only. Angel Broking Pvt. Limited or any of its affiliates/ group companies shall not be in any way
responsible for any loss or damage that may arise to any person from any inadvertent error in the information contained in this report.
Angel Broking Pvt. Limited has not independently verified all the information contained within this document. Accordingly, we cannot
testify, nor make any representation or warranty, express or implied, to the accuracy, contents or data contained within this document.
While Angel Broking Pvt. Limited endeavors to update on a reasonable basis the information discussed in this material, there may be
regulatory, compliance, or other reasons that prevent us from doing so.
This document is being supplied to you solely for your information, and its contents, information or data may not be reproduced,
redistributed or passed on, directly or indirectly.
Neither Angel Broking Pvt. Limited, nor its directors, employees or affiliates shall be liable for any loss or damage that may arise from
or in connection with the use of this information.